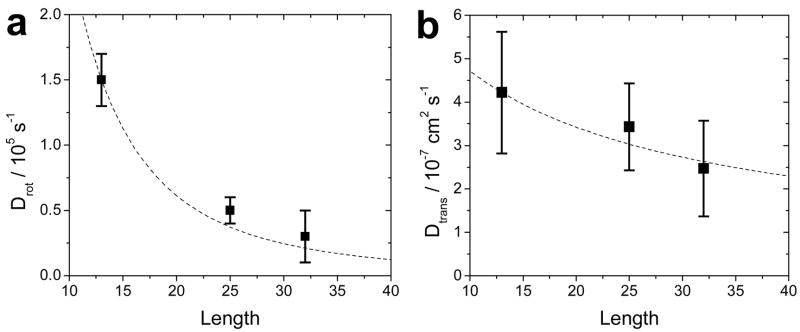
Figure 6.
Rotational (a) and translational (b) diffusion constants as a function of NR length (squares). Diffusion constants are averages of extracted values from GXXX(t), GXYY(t), GCXX(t), GCYY(t), GYYY(t), GYXX(t). The errors are standard deviations. The dotted line represents theoretical predictions according to the Tirado/de la Torre theory and is normalized to superimpose with the first data point.

