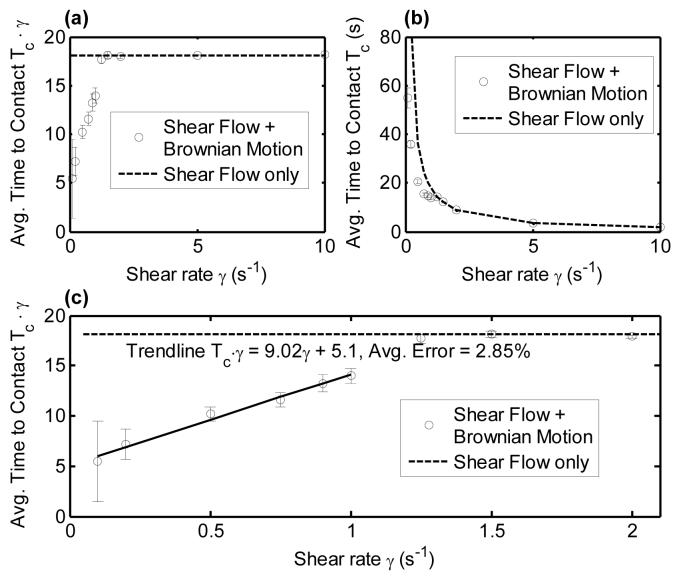
Figure 5.
Plots of the time until surface contact Tc as a function of shear rate for a Brownian platelet at an initial centroid height of 0.8 μm in linear shear flow. The dashed line indicates ‘time until surface contact’ for platelets undergoing linear shear flow only, i.e. Brownian force and torque were not included in the mobility calculations. In (a) ‘Time to contact’ the surface for a platelet is non-dimensionalized with shear rate, and in (b) ‘Time to contact’ is kept in dimensional form. Plot (c) is a magnified version of 5(a) with a trendline plotted to demonstrate the simple linear dependency of non-dimensionalized ‘time to surface contact’ on shear rate when Brownian motion (diffusion) is the dominant mode of cell transport to the surface.

