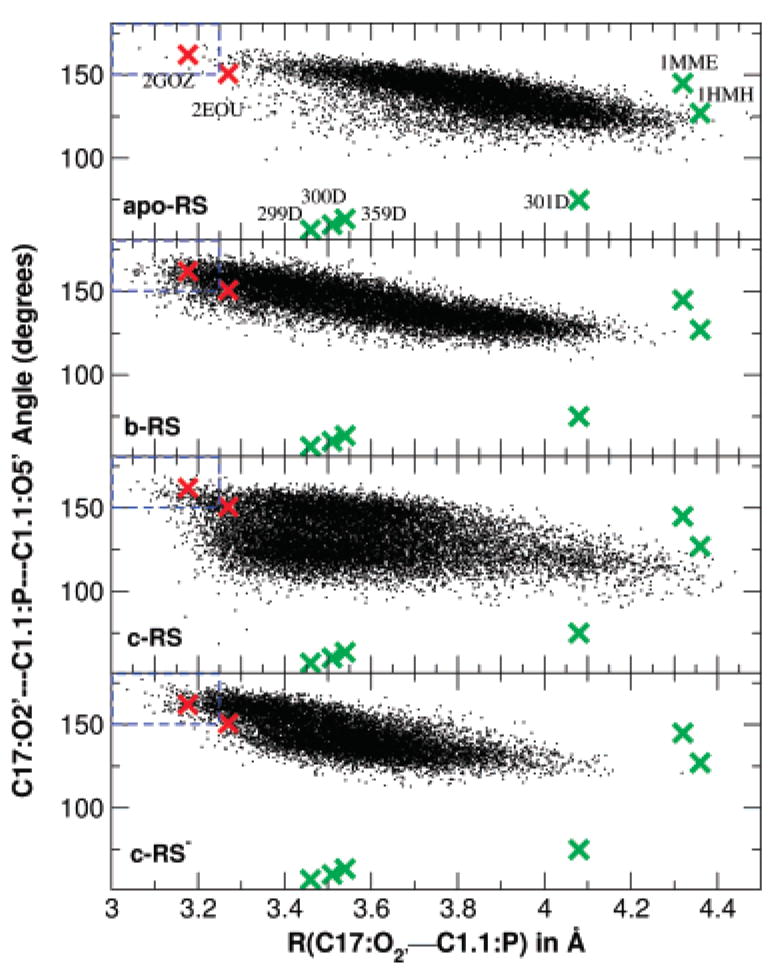
Figure 1.

Plot of the O2′-P-O5′angle versus O2′-P distance for the approach of the 2′-hydroxyl of residue C17 to the phosphate of residue C1.1 for reactant state simulations (small black crosses): apo-RS, b-RS, c-RS and c-RS−. Also shown are data for previously reported minimal sequence Hammerhead RNA X-ray structures (large green crosses, listed in Table 2), and the two full-length hammerhead structures (large red crosses). Dashed lines at 3.25 Å and 150°are the near in-line attack conformation (NAC) region defined by Torres and Bruice.28
