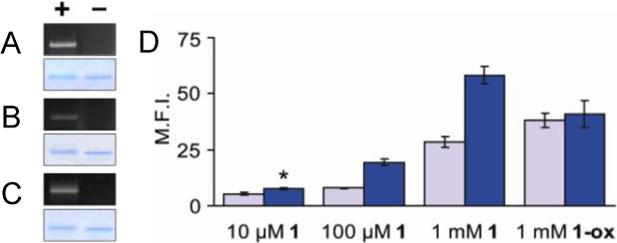
Figure 3.

(A–C) Specific labeling of azido-mDHFR with 1−3. Purified azido-mDHFR (+) and native mDHFR (−) were incubated overnight with 1−3 (10 μM), and the samples were analyzed by SDS-PAGE. The extent of Staudinger ligation was determined by fluorescence (top) and total protein content was determined by staining with Coomassie Blue (bottom). (A) 1. (B) 2. (C) 3. (D) Flow cytometry analysis of Jurkat cells labeled with 1 or the phosphine oxide of 1 (1-ox). The cells were first incubated for 3 d in the presence (blue bars) or absence (gray bars) of Ac4ManNAz (25 μM) and then incubated with 1 or 1-ox for 1 h at rt at various concentrations. M.F.I. = mean fluorescence intensity (arbitrary units). Error bars represent standard deviation of the mean for three replicate experiments. *P < 0.004 (t-test, two-tailed distribution).
