
Fig. 8.
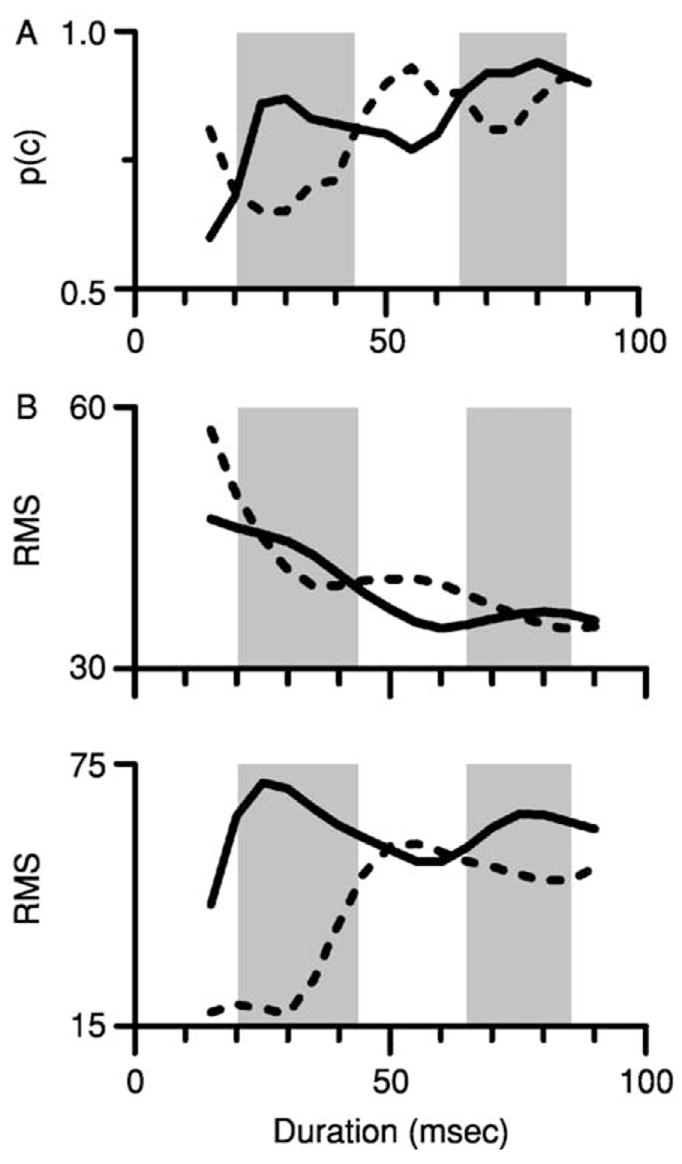
The effect of the phase of the mistuned component on the responses of two simulated IC neurons. (A) Hartmann’s (1988) psychophysical data showing an effect of the phase of the mistuned component on the detection of mistuning (also shown in Fig. 1C). Shaded areas highlight the tone durations at which a mistuned component with phase = 0° was more detectable than the same mistuned component with phase = 180°. (B) Estimates of the detectability of mistuning for the same two phase conditions, derived from the responses of two simulated IC neurons. See Section IV.B. for details. Solid line = mistuned component phase = 0°. Dashed line = mistuned component phase = 180°. Shaded areas highlight the same tone durations as in Panel A.