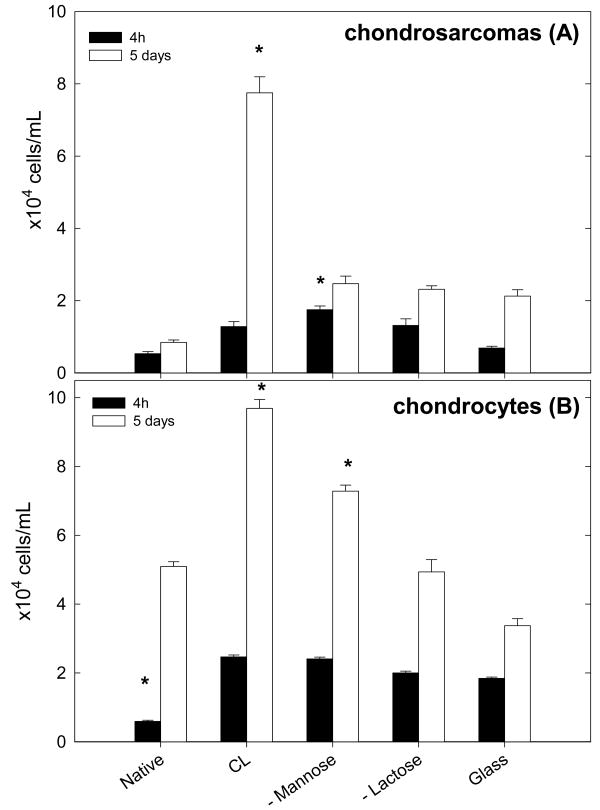
FIGURE 3.
Trypan-blue viability test for the HCS cells (A) and for primary cells (B). Results are shown for four hours in culture (black bars) and after five days in culture (white bars). *Adhesion was statistically different as compared to glass (Kruskal-Wallis oneway analysis of variance, *p < 0.05).

