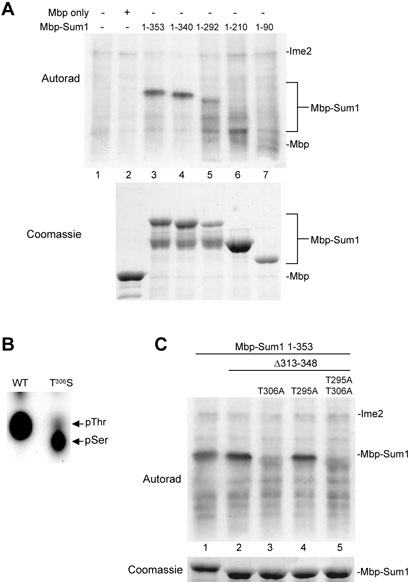
FIGURE 1.
Ime2 phosphorylates Sum1 on T306. Mbp-fusions with N-terminal portions of Sum1 were incubated with Ime2-myc isolated from sporulating cells and radiolabelled ATP. (A) Mbp-fusions to the indicated amino-terminal fragments of Sum1 (lanes 3-7) or Mbp alone (lane 2) were analyzed by electrophoresis and autoradiography (upper). The Coomassie-stained electrophoretic gel of substrates is shown below for comparison. The positions of the Ime2 autophosphorylation and Mbp-Sum1 bands are indicated. (B) Phosphoamino acid analysis of acid-hydrolyzed Mbp-Sum1 1-353 and MBP-Sum1 1-353 T306S proteins phosphorylated by Ime2-myc. The relative positions of phosphothreonine and phosphoserine are indicated. (C) Mbp-Sum1 1-353 (lane 1), and Mbp-Sum1 1-353 deleted for residues 313-348 with the indicated substitutions (lanes 2-5) were analyzed by electrophoresis and autoradiography. The Coomassie-stained gel of substrates is shown below for comparison. The positions of the Ime2 autophosphorylation and MBP-Sum1 bands are indicated.

