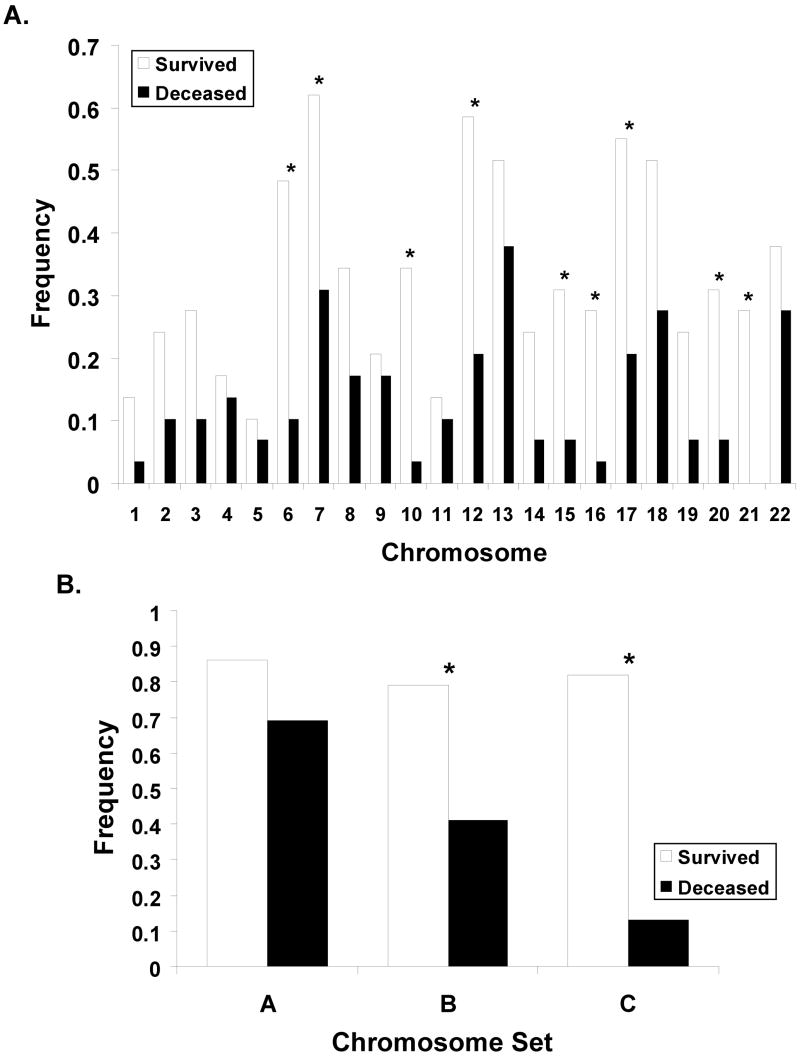
Fig. 2. Whole chromosome changes.
Fraction of samples with whole chromosome variations (gain or loss). Panel A shows the frequency of changes for each of the autosomal chromosomes. Panel B plots the frequency of samples with at least one (column labeled “A”) or two (“B”, “C”) whole chromosome changes, regardless of which specific chromosome are affected. The column labeled “C” in that additionally restricts samples to be from patients diagnosed after 1998.

