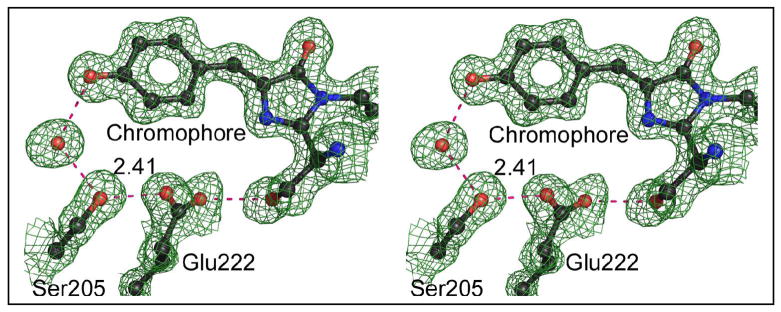
Figure 5.
Stereo image of (2Fo-Fc) electron density map and atomic model of H148D at pH 9.0 showing potential ESPT pathway. Blue spheres are nitrogen, red are oxygen; contour level 1σ. Dashed lines indicate the hydrogen bonds, labeled with distances in Å. For other hydrogen bond lengths refer to Fig. 2c.

