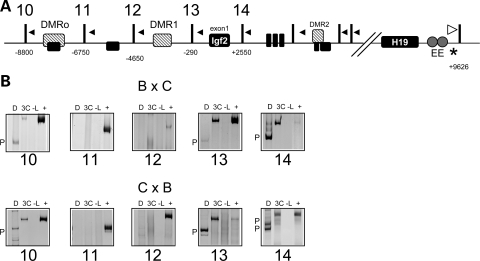
Figure 3.
Analysis of long-range interactions between the endodermal enhancers and the Igf2 locus. (A) Schematic of the Igf2 locus, showing the exons (black boxes) and the differentially methylated regions (hatched boxes, DMRo, DMR1, DMR2). Vertical bars indicate PsuI restriction sites, numbers beneath the sites are the distance relative to the Igf2 exon 1 and the resulting digestion fragments from the region contacted by the endodermal enhancers are numbered (10–14). Downstream fragments showed no contact with the endodermal enhancers (data not shown). Arrowheads represent the location of PCR primers for 3C analysis. The white arrowhead at the endodermal enhancers downstream of H19 is the reverse primer for all reactions, which test for ligation of fragments 10–14 to the EE fragment. An asterisk indicates a restriction polymorphism that distinguishes C57BL/6J and B6(CAST7) alleles. Samples were from wild-type progeny of C57BL/6J and B6(CAST7) mice (B × C, C × B), with the female indicated first. (B) Representative gel image of 3C analysis of interactions of the endodermal enhancers with the Igf2 locus. Shown are the 3C PCR products: D, digested with HaeIII, which distinguishes paternal (P) from maternal alleles (M), 3C, non-digested PCR product; -L, no ligase control; +, positive control. The endodermal enhancers on the maternal chromosome associate predominantly with fragments originating in the paternal chromosome.

