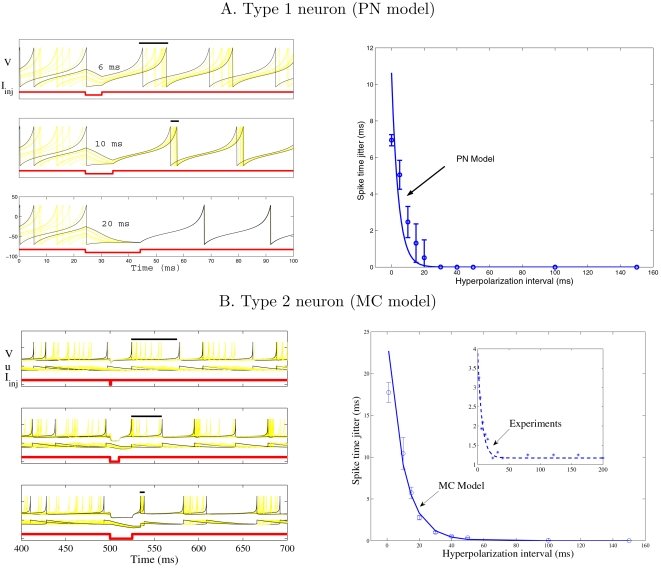
Figure 1. Spike timing precision with somatic injection of hyperpolarizing current.
(A) is for our type 1 model of Projection Neuron (see Methods). Left: temporal evolution of the membrane potential V with somatic injection of hyperpolarizing current pulses I inj of different durations (6, 10, and 20 ms). The spike time jitter (bars above the spikes) is estimated as the temporal dispersion of the first spikes right after inhibition. Right: spike time jitter versus duration of the hyperpolarizing interval. Means and standard deviations are estimated over five runs; The solid curve is an exponential fit of the data (time constant = 4.1 ms). (B) is for a type 2 model of olfactory bulb Mitral Cell. Left: temporal evolution of the state variables (membrane potential V and adaptive current u) for different durations of the hyperpolarizing current (1, 10, and 25 ms). Right: spike time jitter versus duration of the hyperpolarizing interval. Same convention as in (A) (time constant of exponential fit = 9.8 ms). Figure inset represents the exponential fit of experimental data recorded in MCs in vitro (time constant = 6.8 ms), modified from [28], Figure 4A4.

