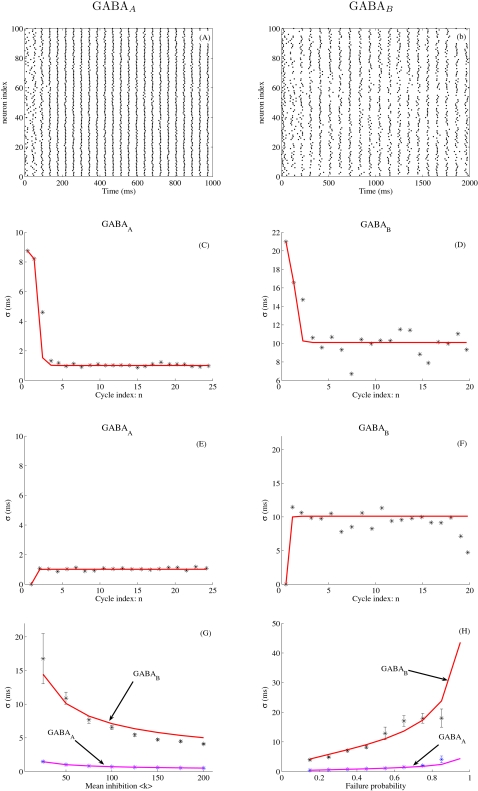
Figure 2. Spike timing precision with GABAA or GABAB inhibition.
In (A–G), the failure probability is P failure = 0.5. (A): Spike rasterplot for GABAA coupling. The peak GABAA conductance is ga = 1 nS. The frequency of the network oscillation is F ∼20 Hz. (B) Spike rasterplot for GABAB coupling (gb = 0.1 nS, F ∼10 Hz). (C,D) Temporal evolution of the spike time jitter σ(n), where n is the index of the oscillatory cycle. Convergence is reached in about 3 cycles, i.e., 300 ms with GABAB and 150 ms with GABAA. The initial condition is the desynchronized state (see Methods). (E,F) Same conventions as in (C–D), except that the initial condition is now the synchronized state. (G) Spike time jitter σ obtained at convergence (σ(n) averaged over the last two oscillatory cycles) as a function of the mean inhibitory drive 〈k〉 received by the neurons (the number of neurons N scales from 50 to 400). (H) σ as a function of the failure probability P failure. In (C–H), the stars represent the spike time jitter estimated from simulations (see Methods, means and standard deviations estimated over 10 runs). The solid curves are for theoretical values obtained from Equation 1 (in C–F) or from Equation 2 (in G–H).

