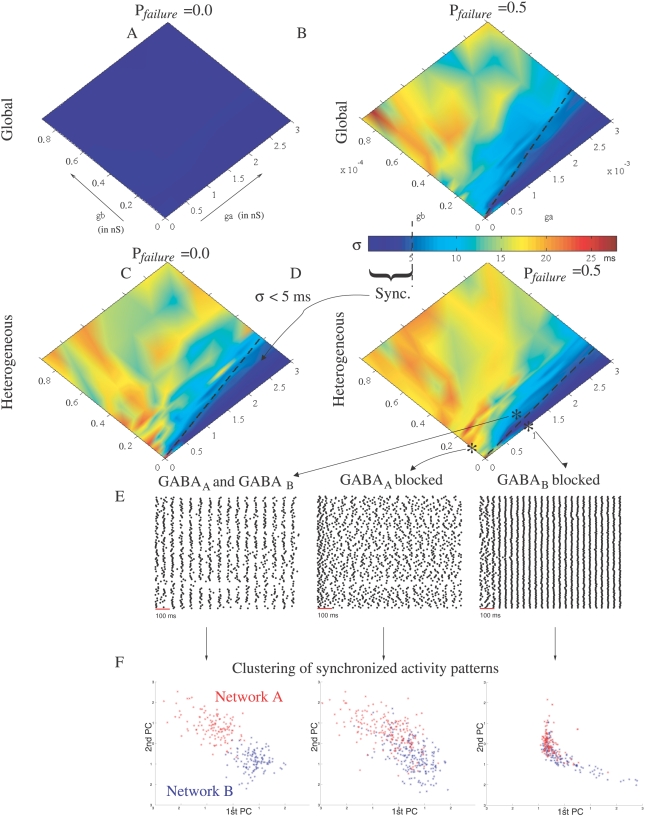
Figure 5. Phase diagrams in the presence of network heterogeneity and/or synaptic failure.
(A–D) The synchronous stationary state (sync.) corresponding to σ<5 ms is depicted as the blue region. ga and gb are expressed in nS and denote the values of the peak conductance g in Equation 12 for GABAA and GABAB, respectively. The dashed lines separating the synchronous state to the asychronous state were obtained by fitting the contour plot σ = 5 ms. The equations of the separating line are ga = 11gb (global, P failure = 0.5, (B)), ga = 14gb (heterogeneous, P failure = 0.0, (C) and ga = 25gb (heterogeneous, P failure = 0.5, (D)). (E) spike rasterplots are indicated for a network (heterogeneous connectivity and P failure = 0.5) with intact connections (ga = 1 nS and gb = 0.1 nS) and with GABAA or GABAB blocked. (F) Clustering of synchronized activity patterns. Two networks (A and B) of N = 100 neurons have been randomly generated with 0.5 probability of connection. At each oscillatory cycle, the network activity is represented as a binary vector in a multidimensional space (N = 100), where each dimension corresponds to the binary state of a given PN (1 if synchronized and 0 otherwise). The resolution at which synchronized neurons are determined is ε = 5 ms (see Methods). We pooled the binary data obtained at the different oscillatory cycles (extracted between 300 to 3000 ms), for the different networks (A and B) and from repeated trials (3 runs for each network). The data were projected, using logistic PCA [36], onto the first two principal components (PC). Red and blue points in the PCA plane are the projected data for networks A and B, respectively. Left is for intact networks, with GABAA and GABAB coupling (ga = 1 nS and gb = 0.1 nS). Middle and right are for GABAA or GABAB blocked, respectively.

