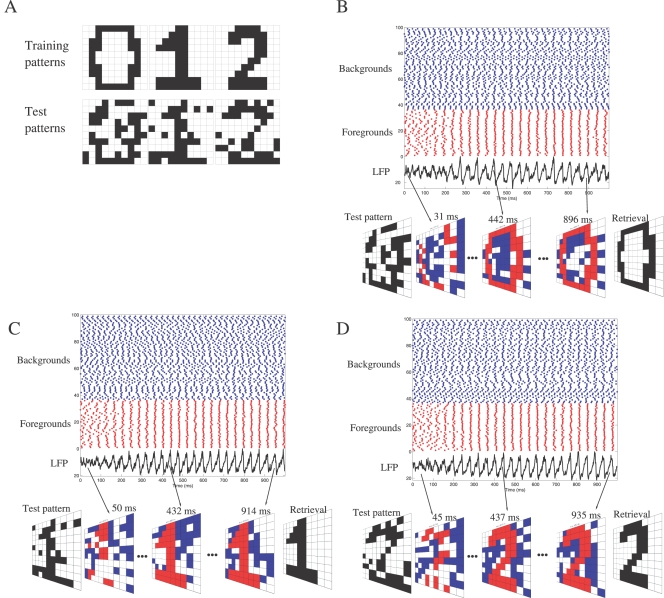
Figure 7. Illustrative example of pattern retrieval.
(A) The learning rule Equation 7 is used to train the GABAergic network (N = 100) with the three images ‘0’, ‘1’ and ‘2’, each one having 36 black and 64 white pixels. Test patterns are noisy versions of the training patterns (20% of the pixels are randomly flipped). (B) The noisy version of ‘0’, presented as input, activates a specific sub-circuit of the trained connectivity. The corresponding network is simulated for 1 sec of biological time. Peak conductances ga = 1 nS and gb = 0.04 nS have been adjusted according to ga/gb = 25 (demarcating the synchronous state in Figure 5D) so that a neuron is synchronized when the number of its GABAA synaptic inputs exceeds that of its GABAB inputs, and is desynchronized otherwise. Neurons that correspond to active and inactive bits in the original training pattern are classified as foregrounds and backgrounds, respectively. In the rasterplot, foreground neurons are artificially grouped to visualize their synchronization (spikes as red dots). Background neurons are desynchronized (spikes as blue dots). The LFP, computed as the average of the PNs' membrane potentials, oscillates at ∼25 Hz. At each cycle, particular neurons fire within a temporal window of ±5 ms around the peak of the LFP. This phase-locked activity is visualized at each LFP cyle (see Video S1 for its evolution). The binary retrieval is formed by assigning bit 1 or 0 to synchronized or desynchronized neurons, respectively. (C) Conventions are similar to (B), except that the noisy version of ‘1’ is presented as input (see Video S2 for the evolution of the phase-locked activity). (D) Conventions are similar to (B), except that the noisy version of ‘2’ is presented as input (see Video S3 for the evolution of the phase-locked activity).

