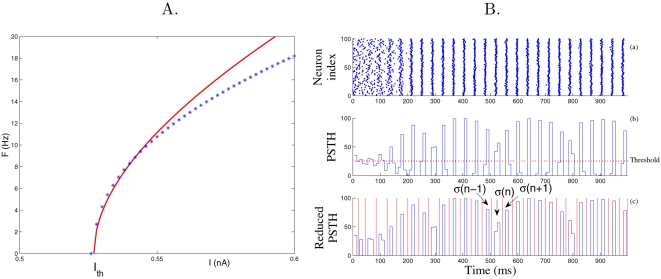
Figure 9. Frequency-current response curve of the PN model (A): Firing rate F versus applied current I, and estimation of the spike time jitter (B).
(A) The curve is for our PN model (Equation 10 with I inj = 0). Stars are for the simulations of the conductance-based PN model from [17],[46]. As expected, our PN model is a good approximation of the type 1 conductance-based model around the rheobase I th [58]. (B) The rasterplots (a) of PNs are integrated over time bins of 5 ms yielding a peri-stimulus histogram (PSTH, see b). The PSTH is further reduced by cutting above the threshold (dotted line in b) corresponding to the mean firing rate (yielding reduced PSTH, see c). From the reduced PSTH, consecutive slots of activity (in red in c) are extracted and the spike time jitter σ(n) is computed as the standard deviation of the spike times falling into each slot n. The spike time jitter at convergence σ is the one obtained at the end of the simulation.

