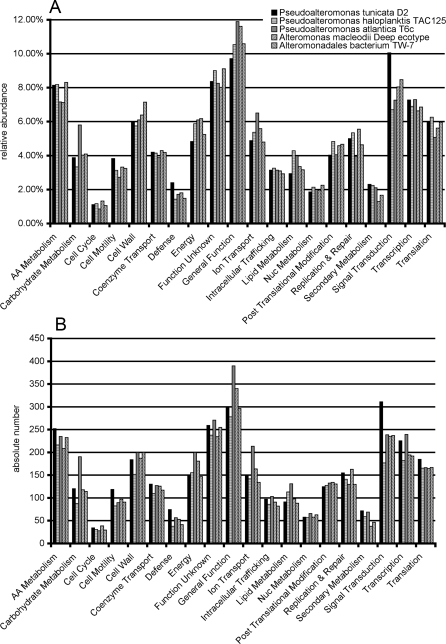
Figure 2. Functional comparison of Pseudoalteromonas and Alteromonas genomes.
Relative abundance compared to all COGs (panel A) and absolute number of categories (panel B) for selected Pseudoalteromonas and Alteromonas species. COGs were extracted from IMG using greater than 30% identity and expectancy values of less than 10−5 cut-offs and assigned to functional categories.

