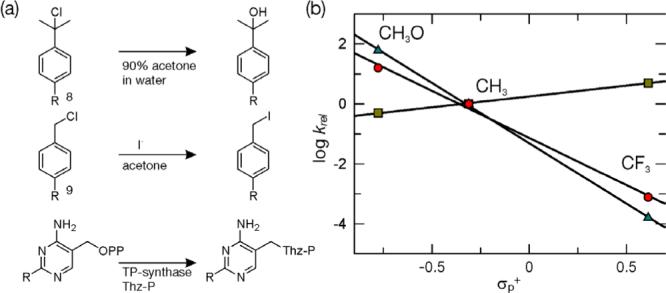
Figure 2. Analysis of the substituent effect on the TP-synthase catalyzed reaction.

(a) Comparison of the SN1 solvolysis of p-substituted tert-cumyl chloride derivatives 8 to the SN2 displacement of benzyl chloride derivatives 9 and to the reaction catalyzed by TP-synthase. (b) Hammett plot (logarithm (kobs/kMe) versus σp+) of the model SN2 displacement reactions (green squares), the model SN1 solvolysis reactions (blue triangles) and the enzymatic reactions (red dots). A linear fit to the enzymatic reaction data gives a ρ value (slope) of −3.14 ± 0.20.
