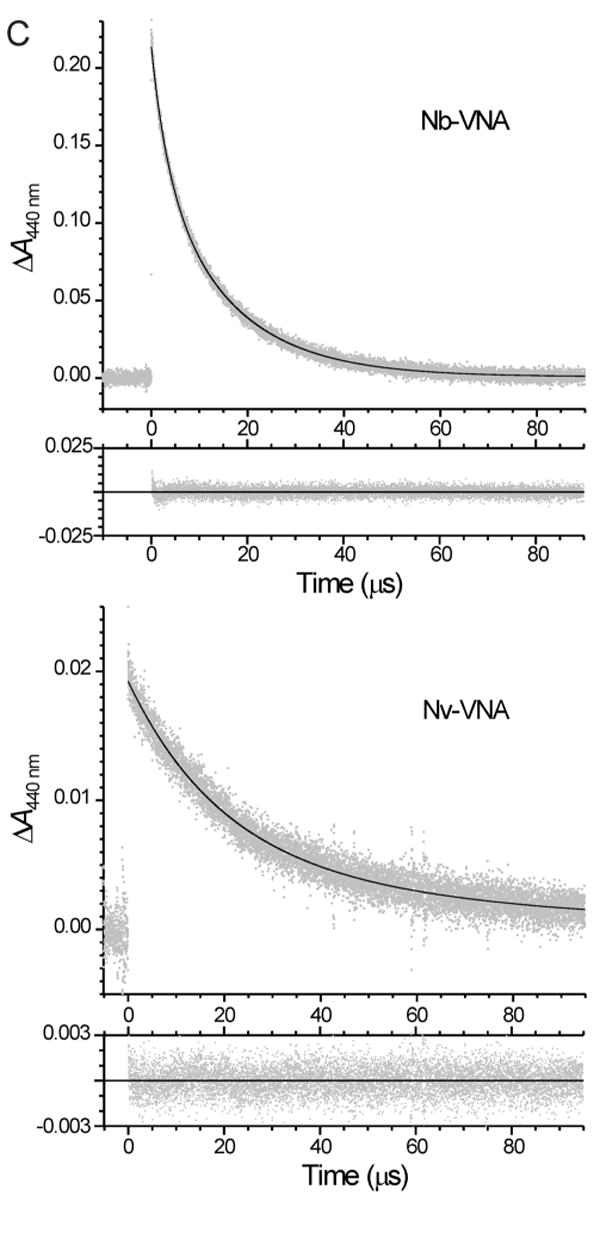
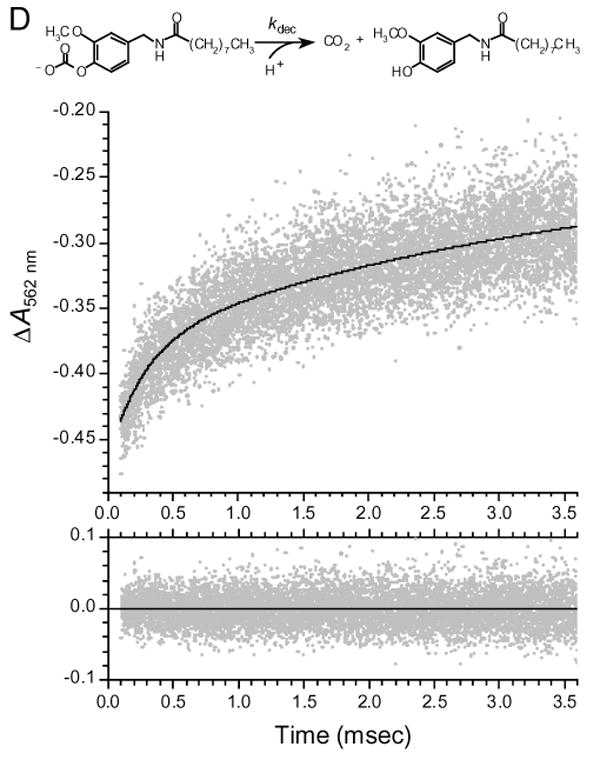
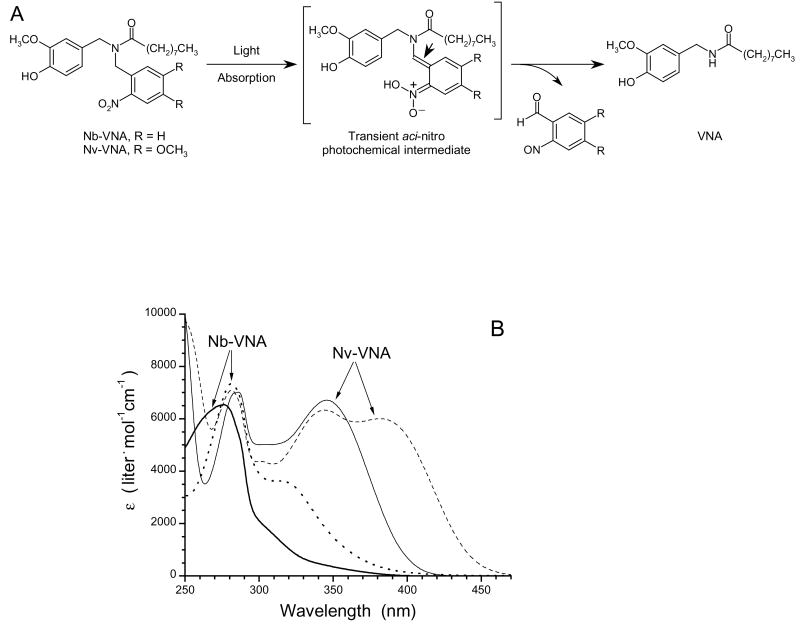
Figure 3A. Spectroscopic characterization of the photorelease of N-vanillylnonanoylamide (VNA) from caged VNA.


(A) Photolysis of caged VNA. Light absorption by caged VNA generates the short-lived aci-nitro intermediate, which decomposes into the spent cage (a 2-nitrosobenzaldehyde) and VNA. The aci-nitro intermediate can exist in two geometric isomeric forms: the configuration around the double bond marked by the arrowhead can be either E or Z. For the Nb cage, R = H; for the Nv cage, R = OCH3.
(B) UV-visible absorption spectra of caged VNAs. Spectra of Nb-VNA acquired before (thick solid line) and after (dotted line) photolysis. Spectra of Nv-VNA acquired before (thin solid line) and after (dashed line) photolysis. Photolysis was for 30 seconds with 375 mW of the UV emission from an argon ion laser.
(C) Transient absorbance spectral changes of Nb-VNA and Nv-VNA following laser flash photolysis. The absorbance at 440 nm of a solution of Nb-VNA or Nv-VNA in acetonitrile was monitored. At time zero, an 8.6-ns pulse of 355-nm light was delivered to the sample. In each case, in the larger panel, gray points are experimental data and the solid black curve is the nonlinear least-squares double-exponential fit to the data; the residuals of the least-squares fit are shown in the smaller lower panel. For Nb-VNA, the two exponential components have time constants τ1 = 3.47 ± 0.05 μs and τ2 = 15.3 ± 0.1 μs, and account for 34% and 66% of the total transient absorbance change, respectively. For Nv-VNA, the two exponential components have time constants τ1 = 19.3 ± 2.1 μs and τ2 = 71 ± 58 μs, and account for 71% and 29% of the total transient absorbance change, respectively. Data shown for Nb-VNA are the average of 5 replicate measurements; data shown for Nv-VNA are the average of 25 replicate measurements. Pulse energies were ∼200 mJ and ∼50 mJ for Nb-VNA and Nv-VNA, respectively.
(D) Kinetics of decarboxylation of VNA-carbonate monitored indirectly with the pH indicator Phenol Red. Generated by photolysis of Nvoc-VNA, VNA-carbonate, the monocarbonate ester of VNA, undergoes decarboxylation, with proton uptake, to yield carbon dioxide and free VNA. The unimolecular rate constant for decarboxylation is kdec. To monitor decarboxylation kinetics, the absorbance of a solution of Nvoc-VNA (525 μM) in methanol-water (8:2) containing 40 μM Phenol Red indicator was monitored at 562 nm. At time zero, an 8.6-ns, 30-mJ pulse of 355-nm light was delivered to the sample. In the upper panel, gray points are experimental data (average of a total of 20 traces) showing the rising phase of the Phenol Red absorbance signal, and the solid black curve is the nonlinear least-squares double-exponential fit to the data. The two exponential components have time constants τslow = 3.50 ± 1.29 ms and τfast = 270 ± 40 μs, and correspond to 37% and 63% of the absorbance increase, respectively. The residuals of the least-squares fit are shown in the lower panel. Before the experiment, the sample was adjusted to pH 8.1 and purged with, and sealed under, argon gas.

