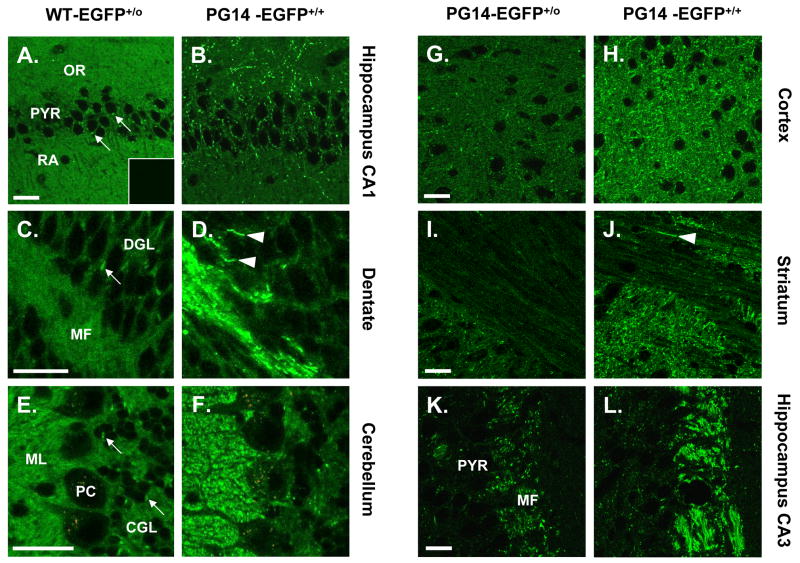
FIGURE 4. PG14-EGFP forms aggregates in multiple brain regions.
(A–F) Comparison of the distributions of WT-EGFP and PG14-EGFP in brain sections. Vibratome sections from healthy Tg(WT-EGFP+/0) mice (A, C, E) and ill, age-matched Tg(PG14-EGFP+/+) mice (B, D, F) were prepared from the CA1 region of the hippocampus (A, B), the dentate gyrus (C, D), and the cerebellar cortex (E, F), and were imaged by fluorescence microscopy. The inset in panel A shows a brain section from a non-transgenic, Prn-p+/+ mouse, to illustrate the background level of fluorescence. PG14-EGFP forms numerous fluorescent aggregates, whereas WT-EGFP has a much more uniform distribution. (G-L) The number of PG14-EGFP aggregates is higher in mice with a homozygous transgene array. Sections from healthy Tg(PG14-EGFP+/0) mice (G, I, K) and ill, age-matched Tg(PG14-EGFP+/+) mice (H, J, L) were prepared from the neocortex (G, H), the striatum (I, J), and the CA3 region of the hippocampus (K, L). Aggregate concentration is increased in animals expressing twice the amount of the transgenic mutant protein. The arrowheads in D and J indicate linear aggregates of PG14-EGFP that probably lie within individual axons. The arrows in A, C and E indicate accumulations of WT-EGFP in the Golgi apparatus of neuronal cell bodies. The abbreviations are: OR, stratum oriens; PYR, pyramidal cell layer; RA, stratum radiatum; DGL, dentate granule cell layer; MF, mossy fibers; CGL, cerebellar granule cell layer; ML, molecular layer, PC, Purkinje cell layer. All scale bars represent 20 μm.

