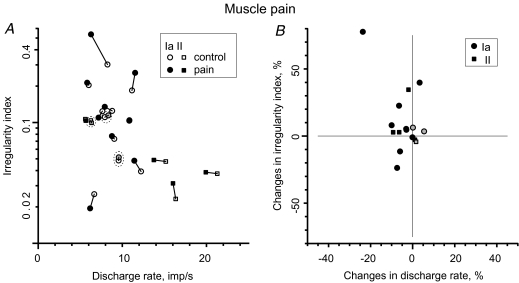
Figure 2. Effect of deep muscle pain on muscle spindle afferent discharge rate and variability.
A, comparison between discharge rate and irregularity index during control period and during painful stimulation. B, changes in the irregularity index as a function of changes in discharge rate. Control and pain periods indicated by open and filled symbols, respectively. Circles represent primary (Ia) muscle spindle afferents and squares represent secondary (II) muscle spindle afferents. Three muscle spindles recorded from subjects who did not feel any pain from hypertonic saline injection are shaded grey instead of black and encircled by the dashed line in A.

