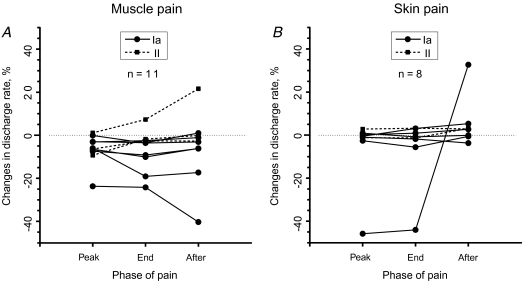
Figure 3. Changes in discharge rate during separate phases of pain.
A, deep muscle pain. B, superficial skin pain. Changes in discharge rate relative to control period are shown for peak pain period (‘Peak’), phase of pain recession (‘End’) and phase after pain completely subsided (‘After’). Single afferents are connected by lines. The circles and continuous lines represent primary (Ia) muscle spindle afferents, while squares and dashed lines represent secondary (II) muscle spindle afferents. Only those afferents which were recorded until pain fully subsided are included in the analyses.

