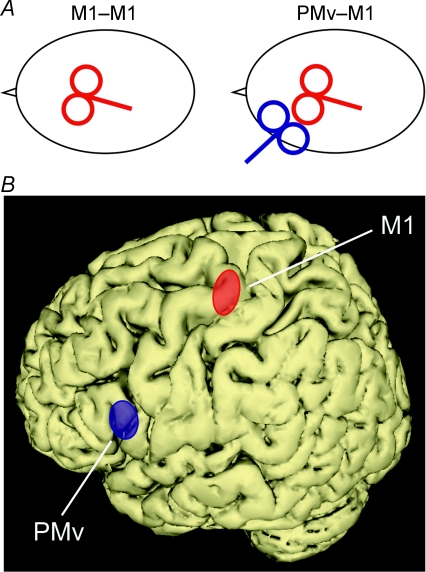
Figure 1. TMS sites.
A, schematic view of the coil positions in the M1–M1 and the PMv–M1 conditions. B, location of the TMS sites as given by the co-registration; PMv is shown in blue (mean MNI coordinates: −58, 13, 19), M1 in red (mean coordinates: −38, −23, 60). The ellipses illustrate the 95% confidence interval centred over the mean calculated for all subjects (n = 7).

