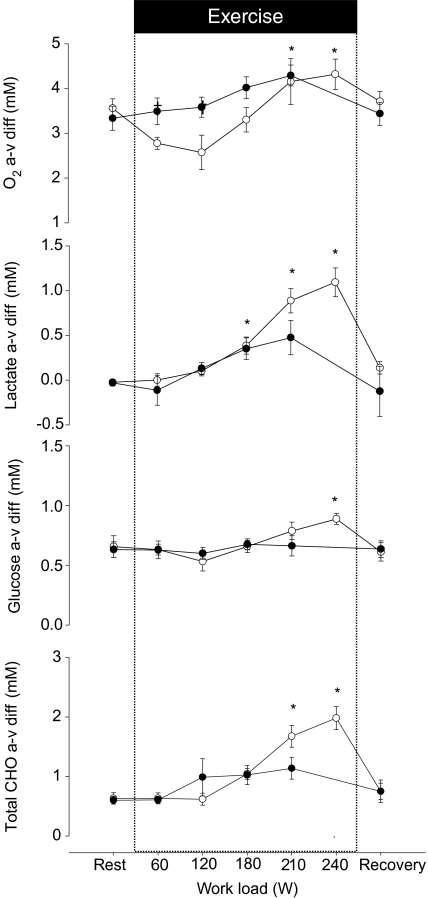
Figure 1. Arterial–internal jugular venous differences of O2, glucose, lactate and (glucose + ½lactate) across the brain in response to incremental exercise with (•) and without (○) administration of propranolol.
During control exercise the subjects became exhausted at a work load of 239 W, but administration of propranolol reduced exercise capacity, with exhaustion appearing at 209 W. Values are mean ± s.e.m.*Different from rest (P < 0.05); †different from control exercise (P < 0.05).

