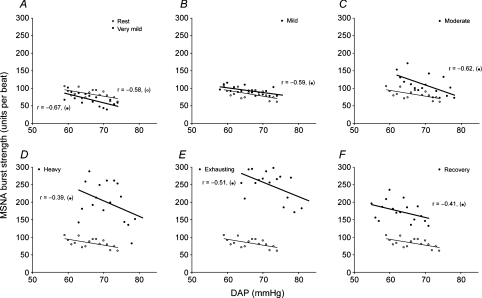
Figure 3. Linear relationships between MSNA burst strength and DAP.
Linear relationships between MSNA burst strength and DAP during the resting period (A–F, ○, thin lines); very mild (A, •, thick line), mild (B, •, thick line), moderate (C, •, thick line), heavy (D, •, thick line) and exhaustive exercise (E, •, thick line); and the recovery period (F, •, thick line) in a representative subject. The regression lines shown in the figure were determined by linear regression analysis performed without weighting of the data.

