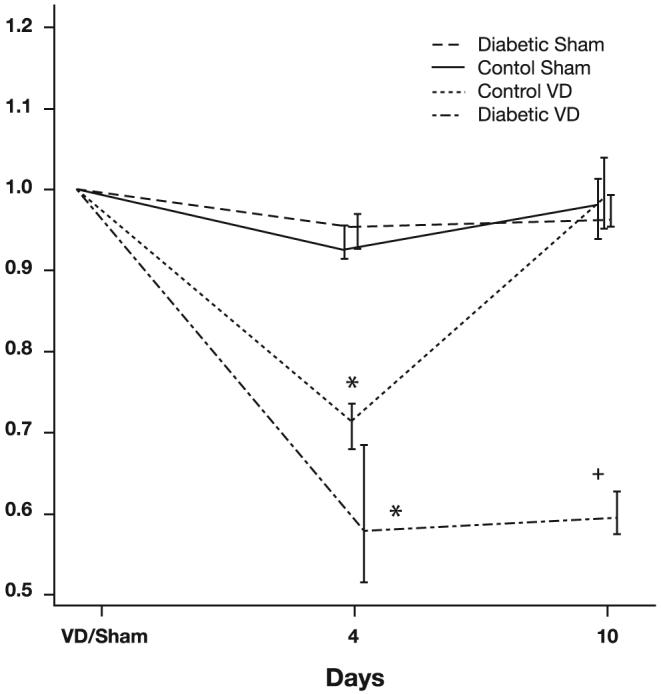
Fig. 1.

Leak point pressure (LPP) normalized to preoperative LPP values in the four study groups. Data are represented as median LPP and interquartile ranges of normalized LPP values. Each data point represents data from 5-8 animals with diabetes mellitus or controls that underwent vaginal distension (VD) or sham distension (control VD). *Significant difference compared with comparable sham animals at the same time point. +Significant difference compared with control animals at the same time point.
