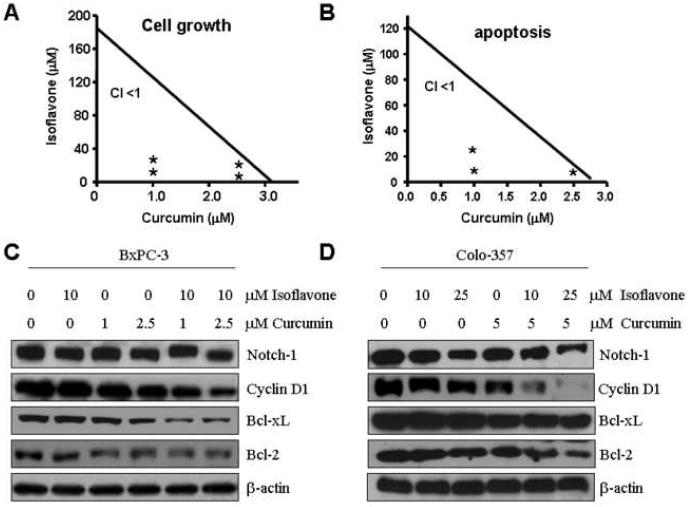
Figure 4.
A-B, Isobologram analyses of synergy between combinations of isoflavone and curcumin in BxPC-3 cells. The cells were incubated for 72 h in the absence (control) or presence of indicated concentrations of isoflavone and/or curcumin. Data points (*) are described by concentrations (in μM) of curcumin and isoflavone reflected on x- and y-axes respectively, and are representative of three independent experiments. Combination index (CI): a quantitative measure of the degree of drug interaction. CI < 1 indicates synergism; CI > 1 indicates antagonism; CI = 1 indicates additive effect.
C-D, Western blot analysis showing changes in the levels of Notch-1, Cyclin D1 and Bcl-xL as well as the levels of Bcl-2 in BxPC-3 and Colo-357 cells treated with isoflavone, curcumin, or their combination for 72 h. β-actin represents protein loading control.

