
Figure 2.
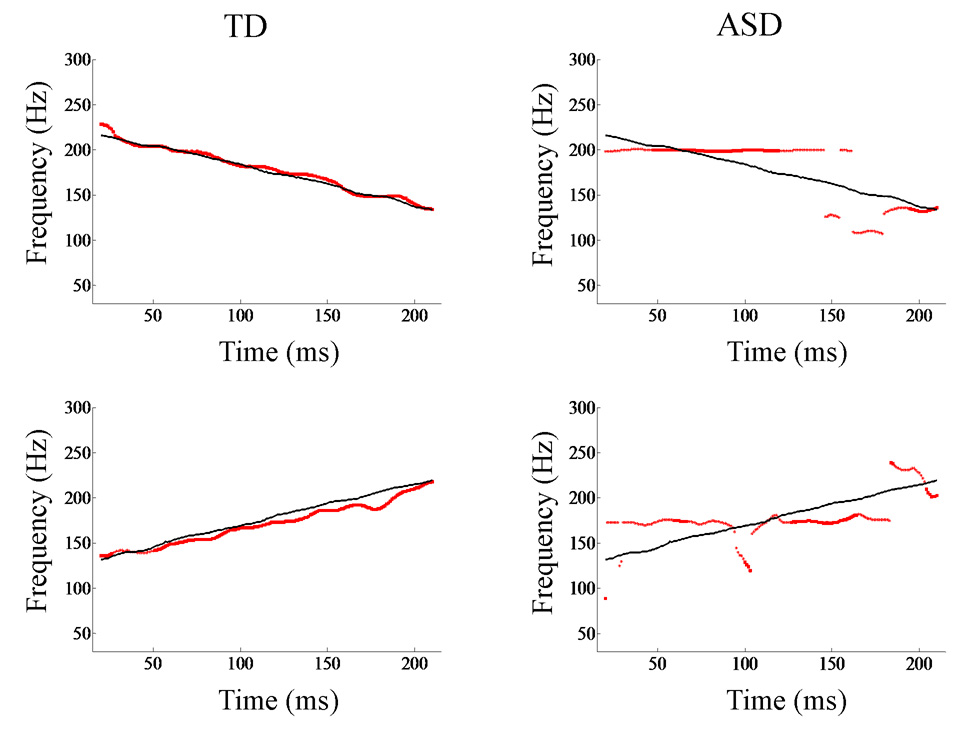
Representative pitch-tracking contours extracted from brainstem responses of TD (left) and ASD (right) individuals. The fundamental frequency contour of the response (red) is plotted against the contour of the stimulus (black). Shown here are data from both the descending (top) and ascending (bottom) /ya/ stimuli. Pitch tracking is more precise in the typically-developing system. Frequency (Hz) is plotted along the y-axis. The x-axis shows the time corresponding to the midpoint of each 40-ms time bin analyzed.