
Figure 3.
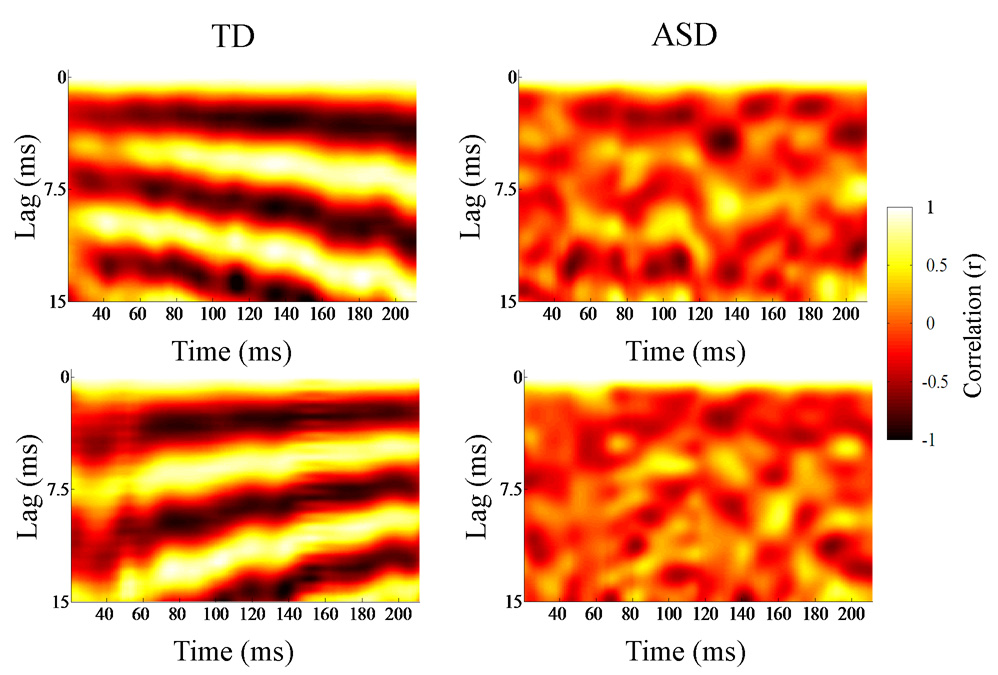
Autocorrelograms of individual TD (left) and ASD (right) brainstem responses to descending (top) and ascending (bottom) /ya/ stimuli. Running autocorrelations quantify the degree of neural phase locking over time. The autocorrelograms (lag versus time) act a means of visualizing periodicity variation over the course of the response. The time indicated on the x-axis refers to the midpoint of each 40-ms time bin analyzed. The y-axis refers to the amount of lag between the signal (each 40-ms time bin) and a time-shifted copy, and the third dimension, Pitch Strength, is plotted using a color continuum from black to white, with brighter colors representing higher correlations, or more robust encoding of the fundamental frequency contour. The TD response indicates more precise phase locking of pitch than the ASD response.