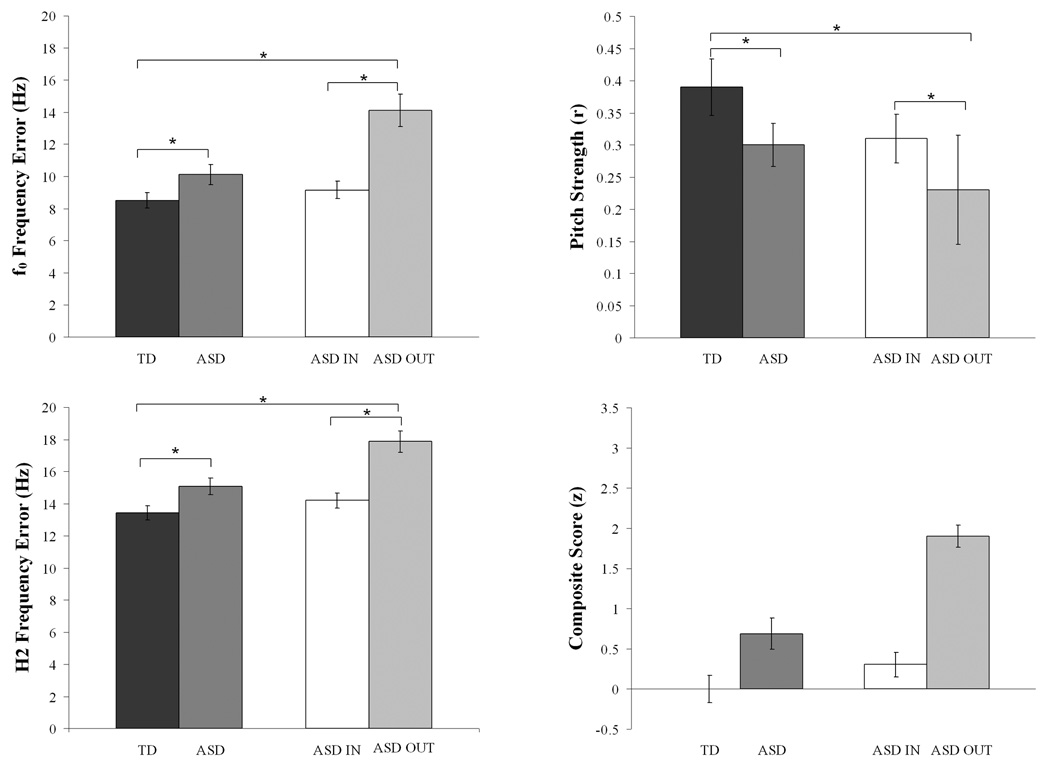
Figure 4.
Group means (standard error) for f0 Frequency Error (Hz), Pitch Strength (autocorrelation r values), H2 Frequency Error (Hz) and Composite Score (z values). Encoding was significantly more precise in TD responses (left, black) as compared to the ASD group as a whole (middle left, dark gray). ASD OUT children (light gray) are those who have pitch tracking composite scores outside of the TD group, while ASD IN children (middle right, white) have scores that are within the normal range. The ASD OUT group (far right, gray) was largely driving the significant group differences, as the ASD IN group demonstrated encoding similar to the TD group.

