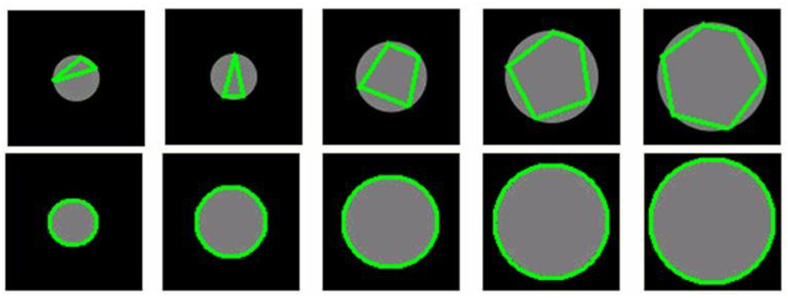
Fig. 5.

Examples obtained by the non-adaptive approach (top row) and the adaptive approach (bottom row). In both examples radius varies from 20 to 60 pixels. For the non-adaptive approach, the marching step is set as 50 pixels and does not change in the marching process. For the adaptive approach, the initial marching step is set as 50 pixels and will change adaptively in the marching process.
