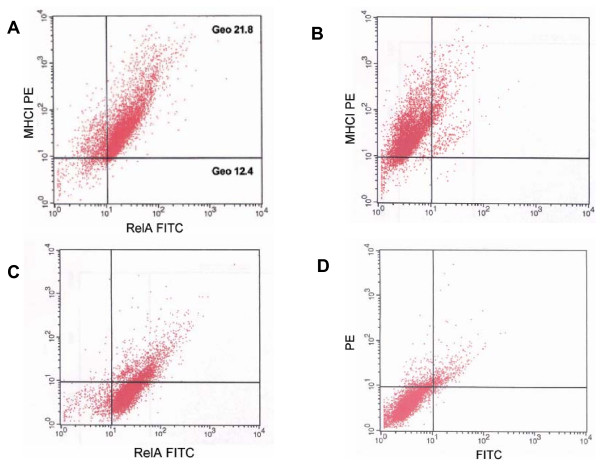
Figure 6.
NF-κB activity in MHCI negative and MHCI positive cells. (A) A representative flow cytometry analysis of the expression of MHCI and NF-κB subunit RelA/p65 proteins showing that epidermal cells that exhibit low expression of RelA/p65 also exhibit lack/low expression of MHCI. The geometrical mean channel fluorescence of the populations is indicated. (B) Single positive control for PE. (C) Single positive control for FITC. (D) Secondary control.

