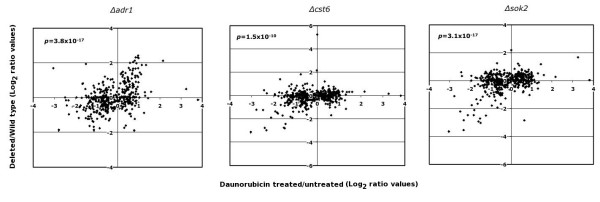
Figure 5.
Transcription ratios between daunorubicin-treated cells and three strains deleted for different transcription factors. The X-axis corresponds to microarray data for cells treated with daunorubicin for four hours (treated vs. untreated, log2 values). The Y-axis corresponds to data from reference [17]. Only data for the 475 genes affected by daunorubicin were considered.

