Figure 4.
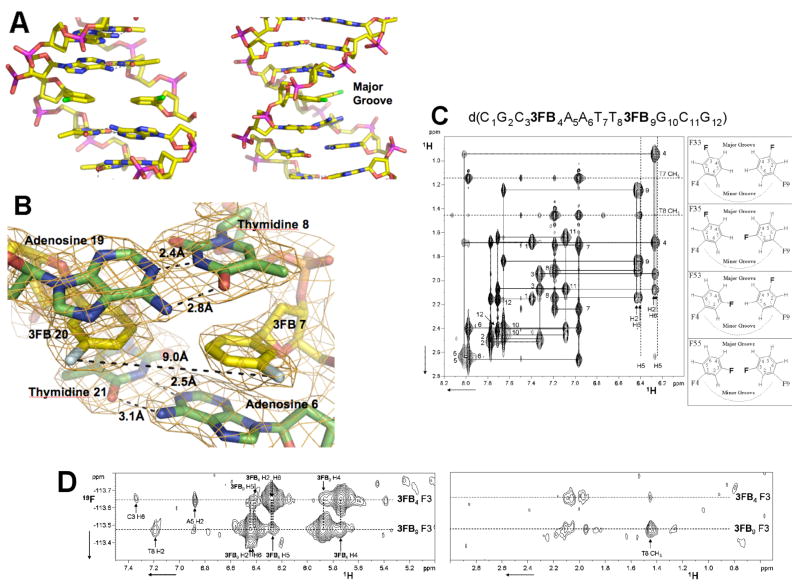
Structural characterization of the d3FB self pair. (A) X-ray structure of the DNA duplex d(C1G2C3BrG4A5A63FB7T8T9C10G11C12G13)2 at 2.8 Å resolution (PDB ID: 2PIS). The d3FB self pair is shown with flanking base pairs. Carbon atoms are shown in yellow, nitrogen in blue, oxygen in orange, phosphorous in magenta and fluorine in green. (B) 2Fo−Fc electron density map contoured at 1.2_ around the model of the d3FB self pair and its adjacent residues. The fluorine atoms are oriented into the major groove and are colored light cyan. Figure produced by Pymol (www.pymol.org). (C) NMR characterization of the DNA duplex d(C1G2C33FB4A5A6T7T83FB9G10C11G12)2. Shown is the aromatic to H2′/H2″ region of a 2D NOESY experiment with the NOE walk indicated by solid lines. Numbers indicate the aromatic to H2′ and H2″ intra-nucleotide peaks. Both the H2 and H6 protons of d3FB9 and of d3FB4 show cross peaks with the H2′ and H2″ protons of the preceding residue indicating rapid flipping of the d3FB rings. The four possible ring orientations of the d3FB used to model the NOE data are shown on the right. (D) 1H-19F NOESY spectrum of d(C1G2C33FB4A5A6T7T83FB9G10C11G12)2 acquired as described previously.46 The fluorine of d3FB9 resonates at −113.48 ppm while the chemical shift of the fluorine of d3FB4 is −113.64 ppm. 19F-1H NOE peaks are labeled according to Figure 4C. Experimental details and spectra are available in the Supporting Information.

