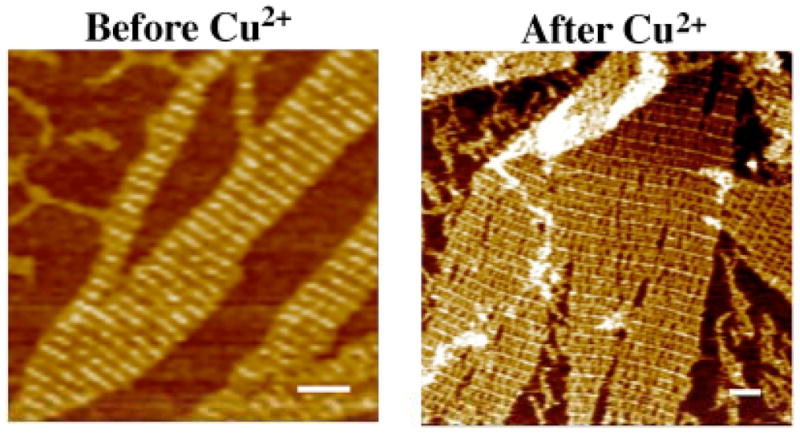
Figure 3.

Atomic Force Micrographs of Two-Dimensional Arrays Containing the DNAzyme Before and After Treatment with Cu2+. The scale bars are 100 nm long. The image on the left has a stripe spacing of 31.5 nm, indicating the presence of the DNAzyme in every other row. The image on the right has a major stripe separated by about 61.5 nm. Close inspection of the image shows a smaller stripe halfway in between the major stripe, corresponding to nucleotides left after DNAzyme cleavage.
