Figure 2.
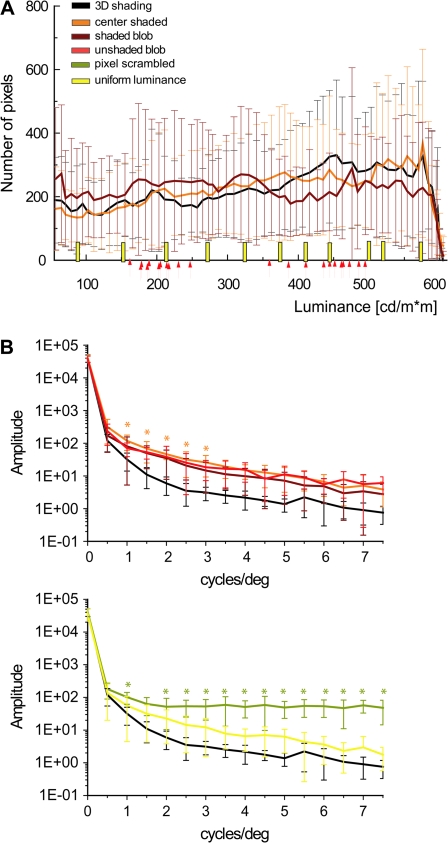
Luminance histograms and amplitude spectra of the stimuli used in the main experiment. (A) Luminance histograms averaged over all 11 shapes (the error bars indicate standard deviations [SDs]) of 3D shaded, center-shaded, and shaded-blob stimuli. Yellow bars indicate the luminance of the uniform-luminance stimuli and the arrows indicate the light and dark gray values for each of the unshaded-blob shapes (see Materials and Methods). (B) Amplitude spectra averaged over the 11 shapes (the error bars indicate SDs). Upper panel: spectra of 3D shaded (black line), center-shaded (orange line), shaded-blob (dark red), and unshaded-blob (light red) shapes; lower panel: spectra of 3D shaded (black line), uniform luminance (yellow line), and pixel scrambled (olive line). The stars indicate frequencies at which spectra differed significantly (1-way ANOVA, P < 0.05) between 3D shaded stimuli and the 2D controls (orange: center shaded; olive: pixel scrambled). Notice that the amplitude spectra were not calculated on the interior of the shapes but on the central 15.4° x 14.5° part of the display.

