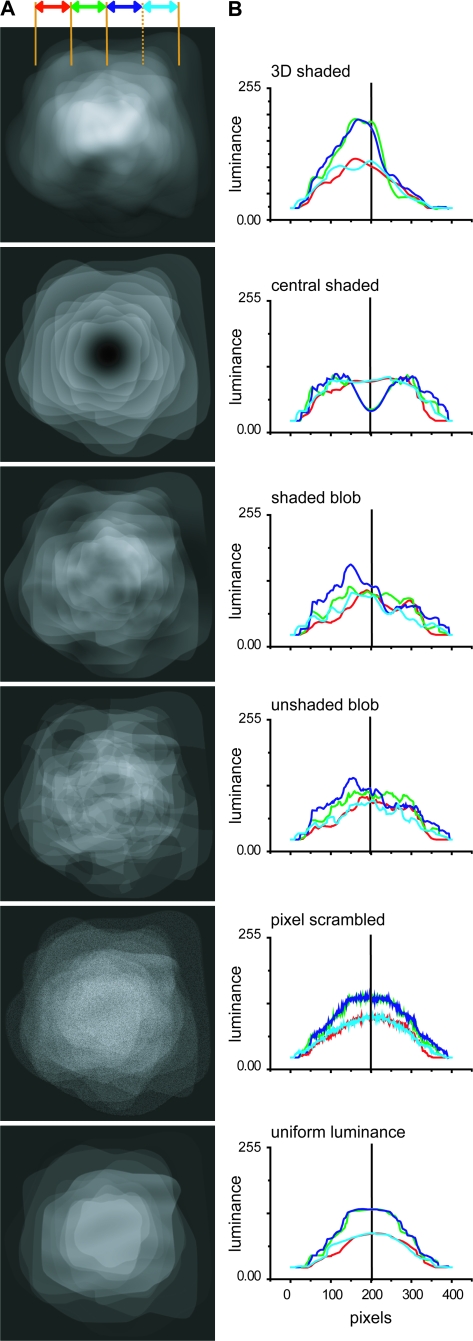
Figure 3.
Average luminance distribution across images in the 6 conditions of the SfS experiment. (A) The luminance distributions in the central 14.5° x 14.5° part of the display, averaged across the 11 stimuli used in each condition. (B) luminance plotted as a function of vertical position to highlight the upper–lower asymmetries in the stimuli. The 4 lines (color code see inset) correspond to 2.5° wide vertical strips, centered on the fixation point, over which luminance was integrated.

