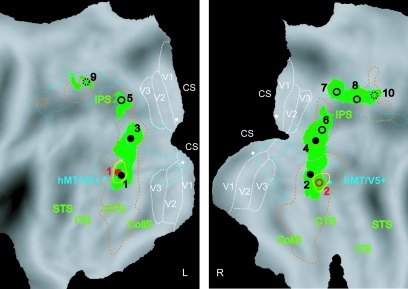
Figure 6.
3D SfS and 3D SfT sensitive regions plotted on the flattened hemispheres (posterior part). Green patches and yellow outlines represent voxels significantly (P < 0.001 uncorrected, Conjunction null analysis, random effect, n = 18) activated by 3D shape defined by texture and shading, respectively. Same conventions as in Figure 5. The 2D shape-sensitive regions (i.e., voxels significant in subtraction intact versus scrambled images) from the LOC localizer (Denys et al. 2004; Kourtzi and Kanwisher 2000) are indicated by dashed orange outlines. Motion-sensitive areas are outlined with blue dashed lines and the blue stars indicate the motion-sensitive region hMT/V5+ (Sunaert et al. 1999). The threshold for LOC and motion localizers is set to P < 0.0001 uncorrected (n = 18, random effect). The early retinotopic areas V1, V2 and V3 (from Caret atlas) are indicated by dotted white lines. White dots indicate location of the V1 probes used in Figure 11 and Table S4. R, right; L, left; CS, calcarine sulcus; STS, superior temporal sulcus; ITS, inferior temporal sulcus; OTS, occipital temporal sulcus; CollS, collateral sulcus.

