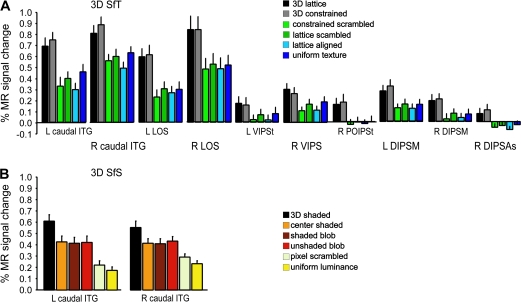
Figure 8.
Activity profiles plotting averaged MR signal changes compared with fixation condition over all subjects (n = 18). (A) 3D SfT sensitive regions: L and R caudal ITG, L and R LOS, L VIPSt, R VIPS, R POIPSt, L and R DIPSM, and R DIPSAs. (B) 3D SfS sensitive regions: L and R caudal ITG. The error bars indicate SEs between subjects. Color bars indicate different conditions following the same convention as in Figure 1.

