Figure 4.
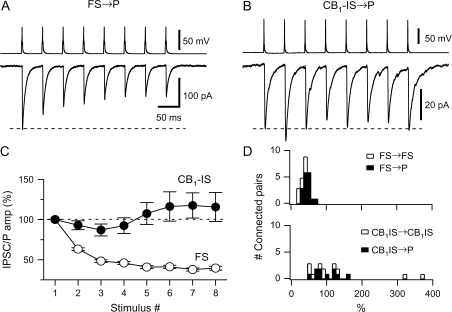
The short-term plasticity of the inhibitory connections of FS and of CB1-IS cells differs. (A) Recordings from a pair composed of a presynaptic FS cell and a postsynaptic pyramid ([Cl−] = 6 mM) in layer 5 is shown. A train of 8 action potentials at 20 Hz was generated in the presynaptic cell. The average of 20 responses is shown in the bottom trace. (B) Recordings from a pair composed of a presynaptic CB1-IS cell and a postsynaptic pyramid ([Cl−]in = 130 mM) in layer 2/3 is shown. A train of 8 action potentials at 20 Hz was generated in the presynaptic cell. The average of 20 responses is shown in the lower trace. (C) Summary data from a total of 25 pairs with a presynaptic FS cell (17 FS → P connections and 8 FS → FS connections) and 20 pairs with a presynaptic CB1-IS cell (10 CB1-IS → P and 10 CB1-IS → CB1-IS recorded in current-clamp or voltage-clamp mode. (D) Histograms showing the distribution of the ratio between the eighth and the 1st IPSC or IPSP for both types of inhibitory connections. Open symbols represent data among interneurons. Filled symbols represent data between interneurons and pyramidal cells.

