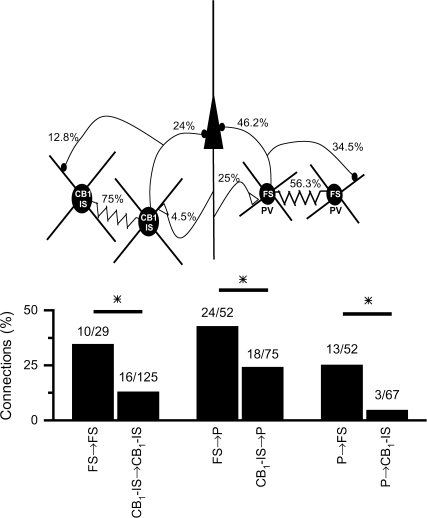
Figure 6.
Synaptic connectivity between FS, CB1-IS, and pyramidal cells. (A) Schematic drawing illustrating the synaptic connectivity among pyramidal, FS, and CB1-IS cells. Numbers represent the percentage of functional connections out of the total connections tested. (B) Summary data on synaptic connectivity. Numbers show the ratio between connected and all the pairs tested for each kind of connection.

