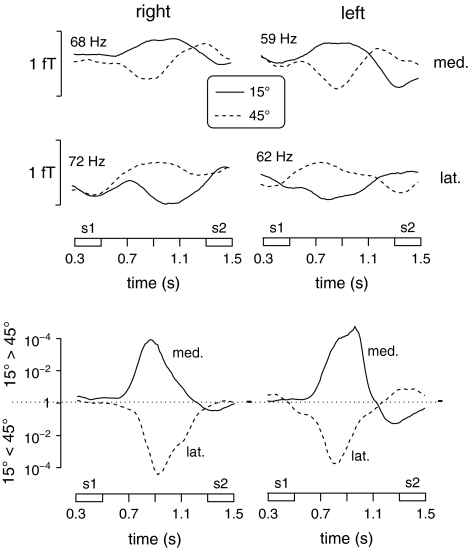
Figure 5.
Time courses between the onset of S1 and the offset of S2 of filtered signals for the frequency ranges with the most pronounced differences between sample stimuli at 15° versus 45° for group R and L (left and right columns, respectively). The graphs in the top 2 rows show spectral amplitude time courses, the graphs in the bottom row depict the time course of the statistical difference between 15° and 45° S1 stimuli. The top left graph depicts spectral amplitude (68 ± 1.5 Hz) time courses at the more medial posterior sensor (med., symbolized by the largest circle in the top left map of Fig. 3) for sample sounds at 15° and 45° (symbolized by the solid and dotted lines, respectively). The middle left graph depicts spectral amplitude (72 ± 1.5 Hz) time courses at the more lateral posterior sensor (lat., symbolized by the largest circle in the bottom left map of Fig. 3) for both sample sounds. The top and middle graphs on the right depict amplitude time courses at 59 and 62 ± 1.5 Hz at the more medial and lateral sensors shown in the right maps of Figure 3, respectively. Time courses of P values for the statistical difference between 15° and 45° stimuli at each sensor (solid lines: medial sensors, hatched lines: lateral sensors) are depicted in the bottom part of the figure.

