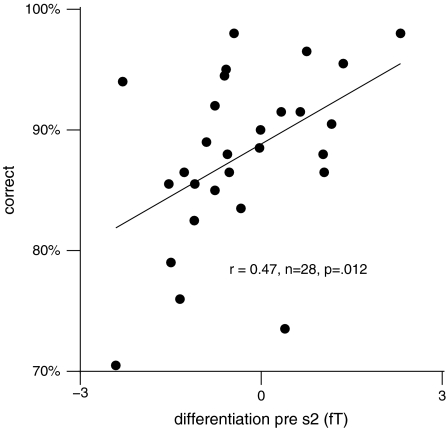
Figure 6.
Correlations between correct response rate (ordinate) and a spectral amplitude measure reflecting the strength of differentiation between the 2 sample stimuli (abscissa) for the entire subject sample across both groups (N = 28). The differentiation measure was computed as the difference between the stimulus-specific GBA spectral amplitude changes at the 2 sensors where these effects were localized during the final 100 ms of the delay phase.

