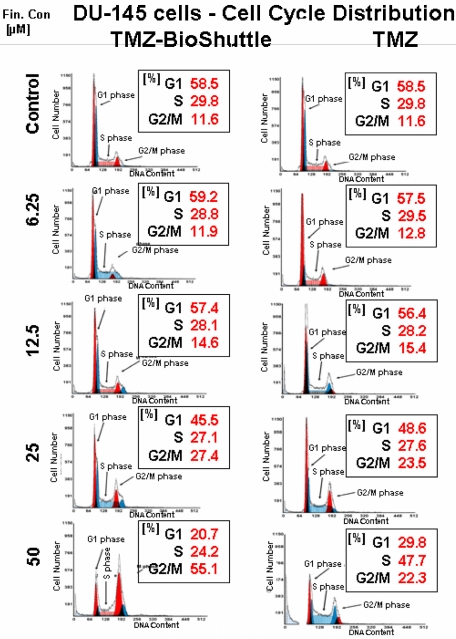
Figure 6.
The cell cycle ratio of DU 145 prostate cancer cells dependent on the applied concentration of TMZ (right column) and TMZ-BioShuttle (left column) 2 days after treatment. The axes of coordinates represent the cell number; the abscissae represent the corresponding DNA content. The left peak depicts the amount of cells in the G1 phase; the area of the right peak describes the ratio of cells in the G2/M phase. The area between both peaks displays the amount of the cell fraction residing in the S phase.

