Figure 1.

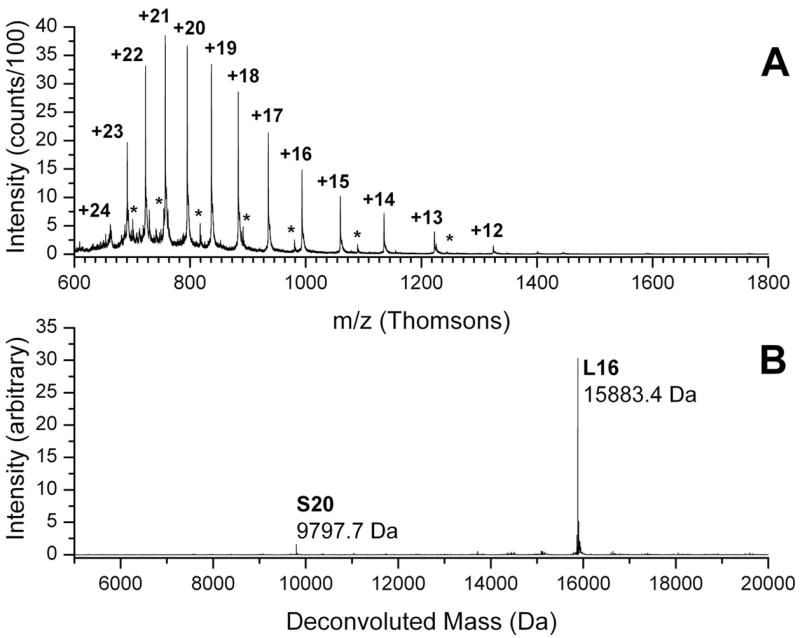
Whole protein mass spectra of Ribosomal Protein L16. (A) Raw spectrum with charge states for Ribosomal Protein L16 as indicated. Asterisks show the less intense +14 to +8 charge states of Ribosomal Protein S20. (B) Deconvoluted spectrum.

Whole protein mass spectra of Ribosomal Protein L16. (A) Raw spectrum with charge states for Ribosomal Protein L16 as indicated. Asterisks show the less intense +14 to +8 charge states of Ribosomal Protein S20. (B) Deconvoluted spectrum.