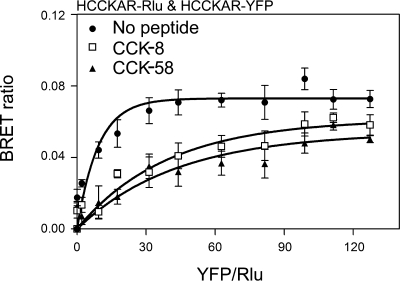
Fig. 4.
Saturation BRET analysis. Shown are BRET saturation curves plotted as the ratios of YFP fluorescence to Rlu luminescence obtained when COS cells coexpressing fixed concentrations of Rlu-tagged CCK1 receptors (donor) and increasing the concentrations of YFP-tagged CCK1 receptors (acceptor) were exposed to the noted peptides. For control cells not exposed to CCK, the BRET ratios generated exponential curves that increased until values reached saturation, as reflected in an asymptote. In contrast, CCK-8 and CCK-58 stimulation yielded BRET saturation curves that were not statistically different from linear fits. Data are represented as means ± SE of 4 independent experiments.

