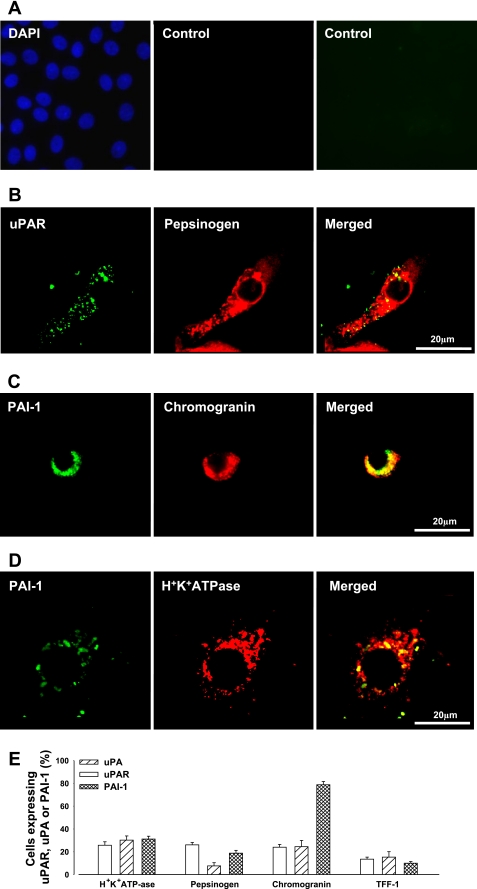
Fig. 2.
Expression of uPA, uPAR, and PAI-1 in human cultured gastric glands. A: controls where primary antibody was omitted (left, DAPI staining of nuclei; middle, Texas red-labeled donkey anti-rabbit IgG; right, FITC-labeled donkey anti-mouse IgG). B: example of expression of uPAR (green, left) in a pepsinogen-positive cell (chief cell, red, middle; merged image, right). C: example of expression of PAI-1 (green, left) in a chromogranin-positive cell, [enhanced chemiluminescence (ECL) cell, red, middle; merged image, right]. D: expression of PAI-1 (green, left) in a H+/K+ ATPase-positive cell (parietal cell, red, middle; merged image, right). E: percentage (%) of H+/K+ATPase-, pepsinogen-, chromogranin-, and trefoil peptide (TFF)-1-positive cells expressing PAI-1, uPAR, or uPA (n = 3). Note that <3.0% of TFF-2-expressing cells expressed uPA, uPAR, or PAI-1.

