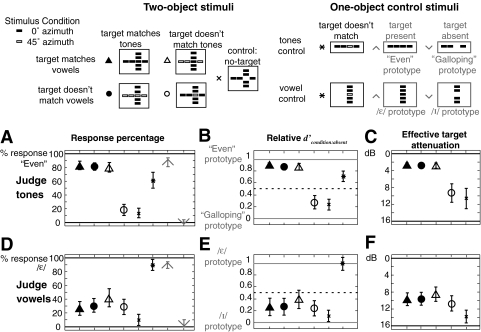
FIG. 3.
Results for tones (top row) and vowel (bottom row). A and D Raw percentage of “target present” responses. B and E Relative sensitivity (δ′; 1.0 indicates raw results identical to those with the target present; 0.0 indicates raw results identical to those with the target absent). C and F Effective target attenuation, based on results from the one-object control experiment (see Fig. 4 for an illustration of how these results are derived). Each marker represents the across-subject mean and the error bar shows ±1 standard error of the mean.

