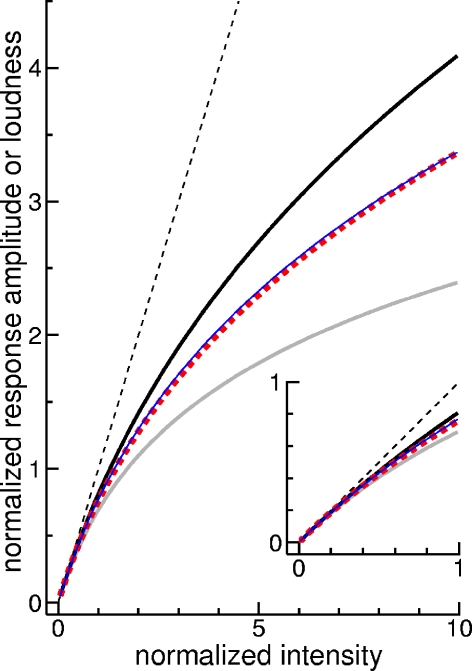
FIG. 11.
Comparison between normalized response amplitude and loudness. As in the right panel of Figure 7, the normalized response amplitudes of the homogeneous and the inhomogeneous auditory-nerve model are shown as a thick gray and a thick black curve, respectively (inset providing magnified view of low intensities). Roughly in the middle between these two curves, the thick dashed curve is found, which represents a normalized version of Zwislocki’s (1965) loudness function. A similar function (thin black curve) is obtained by assuming that a real auditory nerve behaves like a hybrid of the above two model variants.

