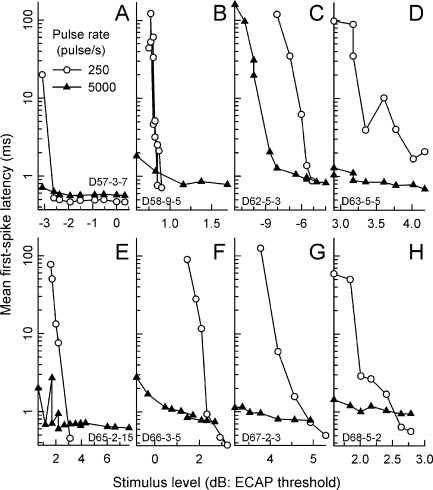
FIG. 4.
Further examination of mean first-spike latencies. In contrast to the data of Figure 3, mean first-spike latencies from eight representative ANFs (from eight cats) are plotted vs. stimulus level (A–H). Data obtained with low-rate (250 pulse/s) stimuli are plotted using open circles, whereas data obtained using 5,000-pulse/s trains are plotted using filled triangles. Stimulus level is expressed in decibels relative to each subject’s ECAP threshold level. The scaling of each ordinate axis is identical.

