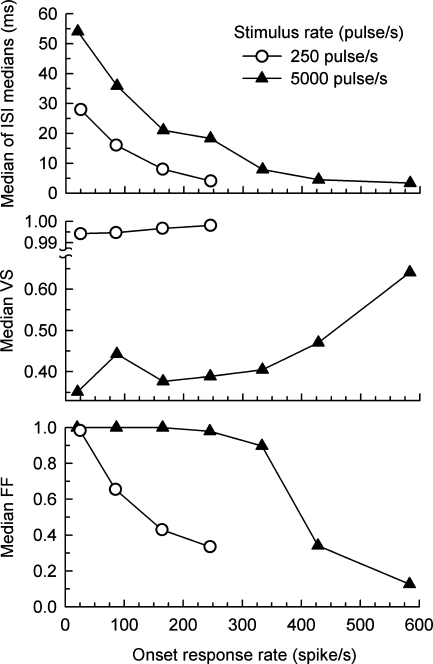
FIG. 6.
“Steady state” values ISI, VS, and FF plotted as a function of onset spike rate. Data for low-rate (250 pulse/s) and high-rate (5,000 pulse/s) pulse trains are plotted using open circles and filled triangles, respectively. Group (across-fiber) values of each measure were computed for spike activity occurring within the final (200–300 ms) response epoch. “Onset spike rate” was computed over the initial (0–12 ms) response epoch. These data were derived from the plots of Figure 5 to more clearly demonstrate the effects of response rate on the measures assessed in the final response epoch.

